bencher 1.116.0
Getting Started
Feature Guide
A Grammar of Benchmarking
Benchmark Health Scorecard
Gallery Overview
Reference Gallery
Reference Gallery
Gallery Overview
0 Float Inputs
1 Float Input
2 Float Inputs
3 Float Inputs
Optimisation
Result Types
Plot Types
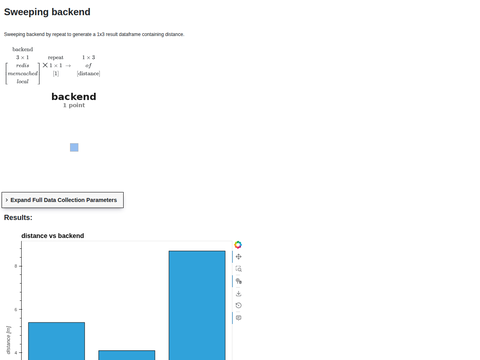
Example Plot Bar
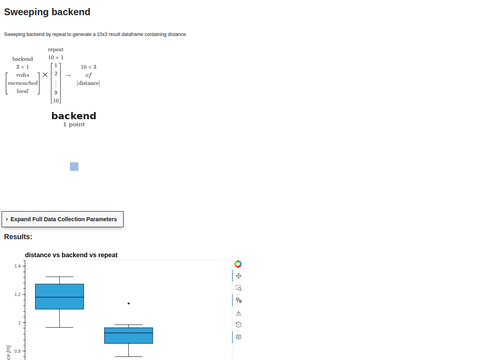
Example Plot Box Whisker
Example Plot Curve
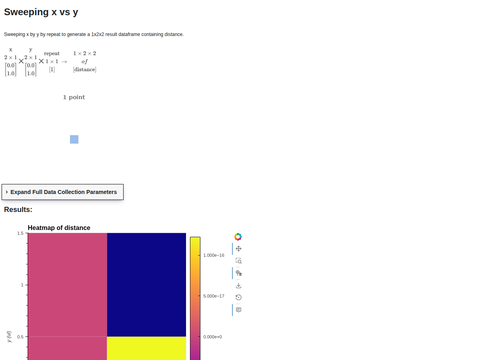
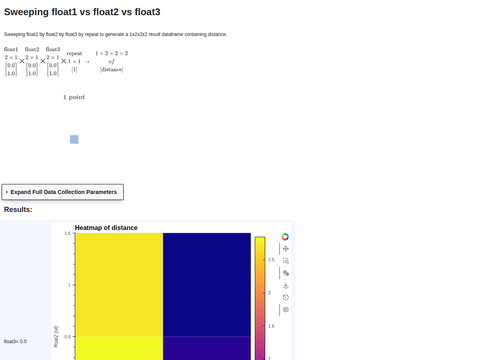
Example Plot Heatmap
Example Plot Image
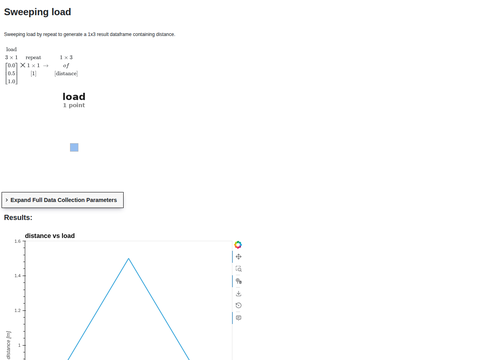
Example Plot Line
Example Plot Scatter
Example Plot Scatter Jitter
Example Plot Surface
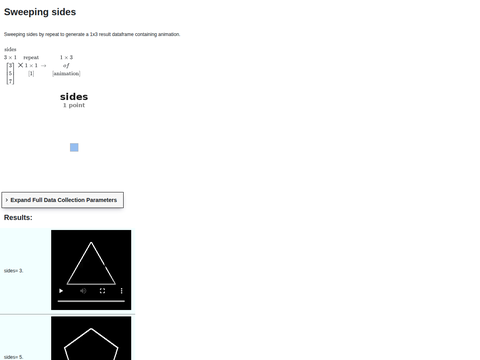
Example Plot Video
Example Plot Volume
Bool Plot Types
Subsampling Divisions System
Sampling Strategies
Composable Containers
Container Tab Layouts
Aggregation
Constant Variables
Statistics
Workflows
YAML Sweeps
Cartesian Animation
Advanced Patterns
Regression Detection
Performance
Publishing
Rerun Integration
API Reference
bencher 1.116.0
Reference Gallery
Reference Gallery
Plot Types
View page source
Plot Types
Example Plot Bar
Example Plot Box Whisker
Example Plot Curve
Example Plot Heatmap
Example Plot Image
Example Plot Line
Example Plot Scatter
Example Plot Scatter Jitter
Example Plot Surface
Example Plot Video
Example Plot Volume